Goal
How can we extract relevant signals from a nested signal overlaid by noise? How can we simultaneously monitor various parameters in a heterogeneous context and at the same location in real-time? And how can we visualize the dependence of these parameters? All these questions can be answered by using data analysis techniques.
Result
By using data mining, statistics, and machine learning techniques, I find patterns even in heterogeneous and complex data sets. Based on this information, I write an algorithm, probability estimation, or statistical model that helps you understand your situation and possible options to choose the best one for you.
HOW TO MONITOR MULTIPLE BIOLOGICAL KEY PARAMETERS SIMULTANEOUSLY?
Nature is highly complex and heterogeneous, notably when viewed at the µm to mm level. At this level, several biogeochemical processes are interleaved, resulting in a heterogeneous and complex network driven by different needs and conditions. To better understand the underlying processes and parameter dependencies, it would be a great benefit to monitoring several of these biogeochemical parameters simultaneously and at the same location. Let’s explain this with an example. But before we start, what are optical chemical sensors?

IMAGING OF CHEMICAL MICROENVIRONMENTS IN 2D
The basic idea of optical chemical sensing is that a chemical compound in the sensor changes its optical properties upon interaction with a specific parameter, such as oxygen, pH, or CO2. Due to the parameter exposure, the compound then changes its color or the intensity of its luminescence.

Over the past years, chemical sensing of single parameter dynamics with optical chemical sensors has developed rapidly, has proven to be beneficial for multiple different approaches, and is now used in a wide range of research areas, including biotechnology and environmental monitoring. One of their main advantages is their flexibility in design. You can have a small single spot of a few µm on the tip of an optical fiber, or you can have a square of several cm2 that you attach to the sample you want to study. The sensor itself can take any shape you can cut out; only the measurement setup around the sensor must be adjusted accordingly. This flexibility, in particular, made the sensors advance in the different fields of application. However, while the sensing of single parameters is well established, sensing of multiple parameters has hardly been possible so far. Reasons for this are manifold, including the challenge of signal overlap and signal processing.
THE CHALLENGE OF MULTI-PARAMETER SENSING
Among different technical, and instrumental challenges, one main issue is to find or synthesize the right indicators that respond solely to the target parameter(s), are stable and do not alter over time, and have the desired optical properties. The latter topic is linked to an even bigger challenge. How can we extract relevant information from a superimposed signal in which signals from different indicators, noise, and other artifacts are interdependent and interleaved, overshadowing the actual correlation and information?
How do we decipher the riddle? · With a good data mining strategy!
To translate the acquired data into meaningful insights, several post-acquisition processing steps must be considered, including sensor drift correction, signal-to-noise ratio improvement, and outlier removal. After these preparatory steps, the actual task of deconvoluting the nested signal and correlating the signals with their respective parameters begins. Here, the goal is to find an efficient, correct, and simple as possible algorithm to describes the hidden and underlying correlation between the spectral properties of the indicators and the parameter concentrations.
A NOVEL APPROACH
When faced with a complex and nested data set, it is especially important to have enough data to reliably find the right pattern. That's why we changed our measurement system from a normal SLR camera to a hyperspectral camera. This way, instead of 3 data points (given by the 3 color channels in the camera), we get information in more than 150 channels, i.e. more than 50 times the information we had before.
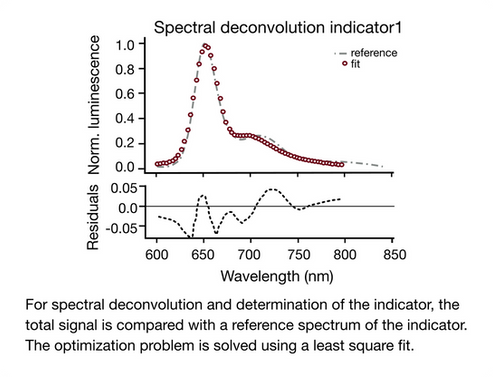
The key aspect here is to understand the many data and find the underlying indicator correlation pattern. For example, when the indicators change only their intensity, it is quite straightforward to take the total signal apart and describe the superimposed signal as a linear combination of the individual contributions for each wavelength.
For one hyperspectral image, the camera scans more than 150 color channels (470-900 nm) with 17 Mpx per band, resulting in 1 GB of data. If you add the calibration images for the sensor and the images captured during a time series experiment, you easily get more than 10 GB of data to be analyzed.
With being the superimposed signal along the full wavelength range (470-900nm), being the spectral responses of the individual indicators, and being the prefactors of the indicators depending on the respective parameter concentration.
In this case, to deconvolute the signal and identify the parameter concentrations, the optimal prefactors can be determined with a least-squares fit:

However, sometimes the situation is even more complex, and the indicators change not only their intensity but also their color (shift along the spectral axis). In these cases, a linear combination would not be able to capture the entire situation, which is why I then used machine learning algorithms, such as XGBoost.
PROJECT GALLERY · WORKING PIPELINE PROJECT 1
Do you want to hear more about data analytics? The paper is published and can be access openly here. If you have questions or want to collaborate, please get in touch with me here.


